For years, the Pro-Hort Programme has generated independent information about how new cultivars perform across different sites and seasons. The challenge was not a shortage of valuable data, but how easily the industry could find, compare and use it.
Evaluation findings were often distributed across reports, spreadsheets and publications. Answering a specific question could require searching through several documents or contacting someone familiar with the programme. This made it difficult for stakeholders to explore the full body of evidence available.
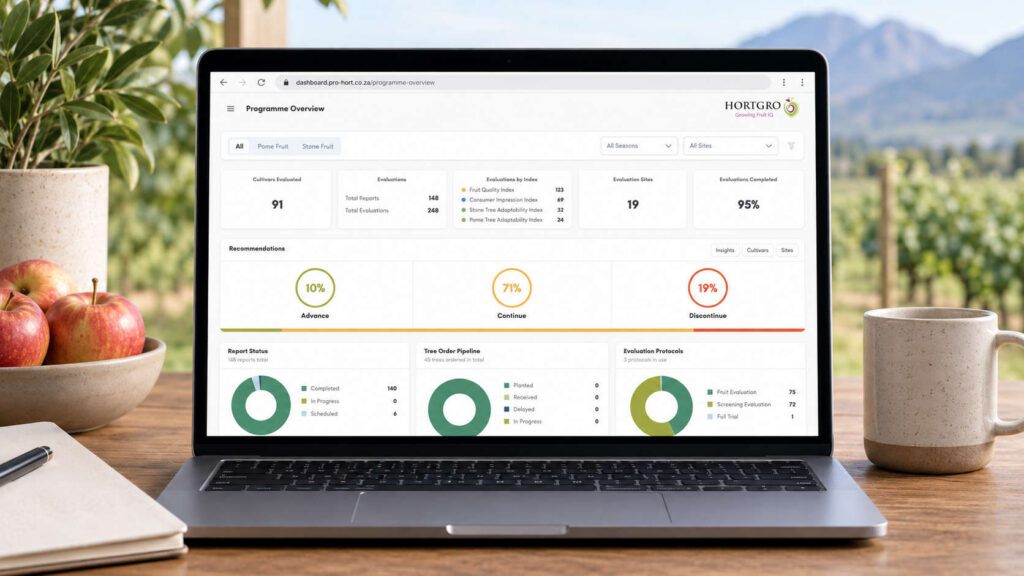
The Pro-Hort Dashboard was developed to shorten the journey between evaluation and informed decision-making. Initiated by Provar and funded by Hortgro, the platform brings information generated through the Pro-Hort Programme into a single digital environment.
It was officially launched at Provar Information Day on 10 September 2026.
The challenge is not only generating data
Cultivar decisions have long-term consequences. An orchard planted today may remain productive for decades, while the suitability of a cultivar can be influenced by its interaction with the site, climate, rootstock, management practices and market.
This means that a single set of results from one site and season rarely provides enough evidence for a planting decision. It is more useful to consider how a cultivar has performed across seasons, whether results are consistent between sites and how the fruit has been received by consumers.
Independent evaluation programmes generate much of this information. However, its value depends partly on whether stakeholders can access and review the findings. Data that remains divided between static reports can be scientifically sound but difficult to apply to practical decision making.
The Pro-Hort Dashboard responds to this challenge by allowing users to approach the programme through the question they are trying to answer, rather than first having to identify the correct report.

Exploring the programme in one place
The Dashboard is a cloud-based platform that can be accessed through a web browser. Users can search for cultivars, view the planting sites and examine flowering, harvest and performance information.
This makes it possible to investigate practical questions such as:
- Where has a cultivar been evaluated?
- How has it performed over multiple seasons?
- When does it flower and harvest?
- Which cultivars may be compatible for cross-pollination?
- How does its horticultural performance compare with consumer responses?
- How does it compare with other cultivars in the programme?
Users can begin with a cultivar, production site or comparison rather than working through a series of separate documents. Relevant Culteva™ reports remain linked to the platform, allowing users to move from a broader overview to the underlying evaluation information.
Information that was previously presented through static tables can also be explored more dynamically. The Cultivar Calendar brings flowering and harvest periods together, while the S-Allele Matrix assists users in investigating potential pollination compatibility. Rootstock information, including characteristics such as parentage, vigour, soil preferences and disease-related attributes, is also included as a reference resource.
The purpose is not simply to place more information on display. It is to make the relationships within that information easier to explore.
Comparison still requires context
Digital access does not remove the need for careful scientific interpretation.
A cultivar that performs well at one site may respond differently under another set of climatic or production conditions. The Dashboard therefore connects evaluation sites to information such as production area, altitude, latitude, longitude, cold accumulation and heat accumulation.
This context helps users assess whether a result may be relevant to their own production environment. It also guards against treating cultivar performance as a fixed characteristic that can be separated from site and season.
The same principle informs the Top Performers section. Rather than emphasising the result of a single season, cultivar performance is considered across the available evaluation history using the programme’s combined performance measures. These include Tree Adaptability, Eating Quality and Consumer Impression.
Consumer feedback adds another important perspective. A cultivar may perform well in the orchard, but its commercial potential also depends on the postharvest quality of the fruit and how consumers respond to it. Bringing these results into the same digital platform allows horticultural performance and consumer impressions to be considered as parts of the same cultivar story.
The Dashboard therefore does not identify one universally best cultivar. It provides a broader evidence base from which users can ask a more useful question: which cultivars have performed consistently under conditions relevant to the decision being considered?

Designing around industry questions
Turning a large collection of evaluation outputs into a usable digital platform required decisions about how information should be organised, connected and presented without removing the context necessary for its interpretation.
Matthew Miller, who led the platform’s development, explains the challenge of presenting the evaluators’ work in a way that answers users’ practical questions:
“Evaluators collect a considerable amount of data on each cultivar over several seasons. The challenge was finding a way to make that information accessible to the people who do not necessarily need to understand every step of the evaluation process. Ultimately, they want to use the results to answer practical questions, such as: which cultivars should I consider planting?”
Seven months of development went into creating the first version of the Dashboard. An important part of this process was moving beyond the structure of individual reports and considering how different users might search for and compare information.
The result is a platform designed around the questions stakeholders are likely to ask, while retaining links to the scientific information on which the summaries and comparisons are based.
Extending the value of independent evaluation
The Dashboard reflects a broader role for Provar within the fruit industry.
Independent evaluation remains central to this role. Provar generates evidence intended to support more informed decisions without promoting particular cultivars or commercial interests. Increasingly, however, producing the evidence is only one part of the work. Consideration must also be given to how that information is structured, preserved and made useful.
Through the Pro-Hort Dashboard, Provar has worked with Hortgro to translate an established evaluation programme into a digital resource for the industry. The platform complements the scientific work behind the programme rather than replacing it.
It also provides a foundation for further development. Future improvements could create stronger connections between cultivars, rootstocks, site conditions and performance, while feedback from users can help ensure that the platform continues to respond to relevant industry questions.
The Pro-Hort Dashboard is open to everyone across the industry it serves — producers, IP owners and technical advisers involved in the Pro-Hort Programme. Access starts with registering at pro-hort.co.za. Once you register, your account is reviewed and approved before you can sign in, which keeps the platform secure while still open to anyone part of the industry.
Industry-funded research creates the greatest value when its findings can inform real decisions. By bringing independent evaluation results into a more accessible and interactive environment, the Pro-Hort Dashboard provides a new way for the industry to engage with the evidence it has helped to generate.
The objective is not to simplify cultivar decisions. It is to give decision makers a clearer view of the evidence, context and comparisons available.
Provar gratefully acknowledges Hortgro for funding this initiative and Matthew Miller for his contribution to the development and implementation of the Pro-Hort Dashboard.

Dr Iwan Labuschagne is the founder and Head of Science at Provar, where he leads the organisation’s scientific strategy and research activities. With a doctorate in genetics and more than three decades of experience in fruit breeding, cultivar evaluation and applied horticultural research, he is widely recognised for his contributions to the advancement of cultivar evaluation in South Africa and internationally. His passion for rigorous science, practical problem-solving and long-term industry development has helped establish Provar as a trusted partner, while mentoring and developing the next generation of agricultural scientists.