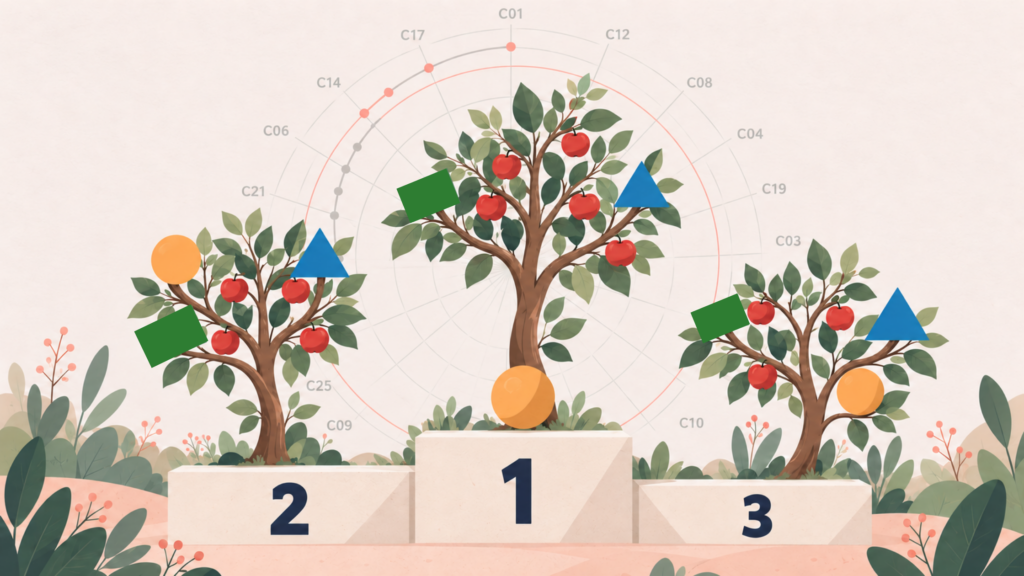
Cultivar evaluation generates large amounts of information across environments and seasons. Reporting every trait separately preserves biological detail, but as the number of traits, cultivars, sites and seasons increases, important trends can become buried in the volume of data. Technical reporting therefore needs to make this information more manageable without compromising reliable interpretation.
This raises an important question: Can complex evaluation data be simplified enough to make technical reporting practical, while retaining the biological information, critical thresholds and supporting evidence required to keep the interpretation reliable?
What is a multi-trait horticultural index?
The term index is used broadly in horticulture. For this article, a multi-trait horticultural index refers to an index that integrates several measured horticultural traits to a single value to represent a defined aspect of cultivar performance and support a particular technical decision.
Indices may serve very different purposes. Maturity indices combine measurements associated with fruit development to support harvest decisions, while others describe fruit quality or stress tolerance. Some integrate several traits to support genotype selection. Olivoto and Nardino (2021), for example, developed the MGIDI approach to integrate multiple traits. Adaptability indices may instead consider performance across environments, including performance and stability. Olivoto et al. (2019b), for instance, proposed an approach combining multi-trait performance and stability across environments. Index construction and interpretation should therefore reflect what each index is intended to represent.
Why integrate multiple traits into one index?
Cultivar performance is rarely determined by one or two characteristics. Several traits may need to be considered simultaneously, while differing in units, what constitutes a desirable value or range, and relationships with one another, with favourable responses in some traits potentially accompanied by less favourable responses in others.
Multi-trait indices provide one way of organising this complexity. They can place measurements on a comparable basis and integrate biologically relevant characteristics into a more manageable representation of a defined aspect of performance.
Combining more information does not automatically produce better information. Index development starts by defining what the index is intended to represent, what constitutes a desirable response and which decision it should report. This relates to validity: whether the measurements and analytical approach adequately represent what the index claims to describe. Index performance cannot compensate for a mismatch between what the index represents and what the industry needs to decide.
Indices therefore add value to industry decisions when they simplify relevant information in a way that remains aligned with the decision being made, without obscuring biological meaning or decision-critical information.
Choosing the right traits
Trait selection should transparently consider horticultural and commercial relevance to the intended decision and stakeholders. It should also account for the ability to distinguish among genotypes, relationships among traits, measurement reliability and precision, environmental sensitivity and genotype × environment interaction, and practical measurement requirements. Available traits are not necessarily appropriate traits: selecting variables primarily because they are routinely measured can produce an index that reflects the dataset rather than the intended concept.

Relationships among traits also matter. Strongly correlated traits may provide overlapping information. When several traits measure the same underlying biological characteristic, multicollinearity may give that characteristic disproportionate influence in the index, depending on how the traits are combined. A genotype that performs well for that trait may therefore gain a greater contribution to its overall rating than a a genotype that excels in another important characteristic represented by only one trait. This can distort comparisons of overall performance. However, correlation alone does not justify removing a trait. Strongly correlated traits may still measure biologically distinct characteristics that are independently relevant to the intended decision.
Deciding how traits contribute
Once traits have been selected, different approaches can determine how these traits contribute to the index. Traits may be scored, ranked or weighted. Multivariate methods can account for relationships among them, while ideotype-based approaches assess how closely a genotype matches a defined combination of desirable trait values. However, as Debnath et al. (2024) caution, these targets may be realistic individually but biologically unattainable in combination. Distance from such an ideotype may therefore give a misleading impression of how close a genotype is to an achievable desirable outcome.
The desired response also varies among traits. Higher values may be preferred for some traits, lower values for others and an optimum range for others. The choice of index must also suit the analytical framework. Olivoto et al. (2019a), for example, describe different approaches depending on whether genotypes are treated as fixed or random effects. This distinction affects how results are estimated and interpreted, although the statistical detail is beyond the scope of this introductory article.
The calculation should be reproducible from the underlying data and documented methods. A simple output for industry use should remain supported by transparent, rigorous science.
Not every decision-critical trait necessarily needs to form part of the composite index. Traits with critical biological, technical or commercial cut-off points may be better retained as separate decision criteria where crossing the threshold could exclude a genotype regardless of its overall index value.

What gets lost in a single score?
Aggregation inevitably removes some detail. Two cultivars may achieve similar index values through different combinations of trait responses, obscuring biologically or commercially important differences. Conversely, a small numerical difference in index values may change their ranking without indicating a meaningful biological difference.
Uncertainty concerns how precisely an index result is known. Sensitivity describes how much it changes under reasonable alternative analytical choices. Both affect confidence in its interpretation. Evaluation coverage concerns the conditions represented by the data. Four locations evaluated in one season provide broader spatial coverage, while one location evaluated over four seasons provides broader temporal coverage. Although both designs contain four environment combinations, they provide different evidence about adaptability. Cultivars with different evaluation histories may therefore have similar index values but differ in the strength and coverage of the supporting evidence.
The index summarises the result; the evidence base determines how confidently it can be interpreted. Both should remain visible.
Why performance and stability must be considered together
Performance and stability describe different aspects of genotype response across environments. Olivoto et al. (2019a), for example, show how they can be combined within an index, with their relative weights determined by the objective. This can support selection and scientific evaluation. For industry interpretation, however, it may be useful to retain mean performance, stability and the underlying genotype × environment interaction pattern alongside the combined value. Stability provides a measure of the consistency of a genotype’s performance across environments, while the genotype-environment interaction pattern helps explain how and where that response occurs.
Stability may be desirable when the objective is broad adaptation and predictable performance. However, high genotype × environment interaction is not necessarily undesirable: it may reveal that a high-performing genotype is particularly suited to specific conditions, providing useful evidence for cultivar recommendations.

Stability can be defined and quantified in different ways, and its relationship with genotype-environment interaction depends on the analytical approach. Importantly, the same level of stability can have different implications depending on performance. The simplified examples below therefore illustrate why performance, stability and environmental response should be interpreted together rather than representing fixed stability classifications.
| Performance | Stability/environmental response | Possible interpretation |
|---|---|---|
| High | Relatively stable across environments | Potential broad adaptation |
| High | Marked, interpretable environmental response | Potential specific adaptation |
| High | Marked response without a clearly interpretable pattern | High performance requiring further interpretation |
| Moderate | Relatively stable across environments | Stable, but moderate performance |
| Low | Relatively stable across environments | Stable, but low performance |
When performance and stability are combined in an index, mean performance and the underlying genotype × environment interaction pattern may still need to remain visible. Together, they help distinguish broad adaptation, potential specific adaptation and responses requiring further investigation.
How index design influences the result
Three design choices shape an index result: how traits are scaled, how much each contributes and how far a favourable response in one trait can offset an unfavourable response in another.
Scaling makes measurements expressed in different units comparable. The index must also account for whether higher, lower or intermediate values are preferred. The reference population used for scaling or comparison also matters. Where scores depend on their distribution or ranking, adding genotypes, environments or seasons may change an existing genotype’s score or its interpretation, even if its measured performance remains unchanged.
Weighting determines each trait’s intended contribution. Equal weights can have unintended consequences depending on how traits are grouped and aggregated (Dobbie and Dail, 2013). Assigned weights may also differ from actual influence, because trait variability and relationships among traits affect the result (Becker et al., 2017).
Compensation describes the extent to which favourable responses in some traits offset unfavourable responses in others. A favourable overall outcome may conceal an undesirable individual trait response (Debnath et al., 2024). The permitted degree of compensation should be biologically defensible.
When a score becomes a class
Converting continuous index values into classes such as highly adapted, moderately adapted or poorly adapted can simplify communication but may create artificial distinctions. Genotypes just above and below a threshold may perform very similarly yet receive different labels. Classification thresholds should therefore have a defensible basis and be assessed during validation.

Why data quality matters
Measurement error, poor repeatability, missing observations and inconsistent measurement quality can all affect an index result. How missing values are handled can also influence the outcome. The strength of the evidence depends not only on the quantity of data, but also on their structure, quality and representativeness. An index can make good data easier to interpret, but it cannot overcome poor data quality or limited coverage.
Why indices need to be validated
Successfully constructing an index does not establish its reliability for technical use. Validation examines whether the index and its interpretation are reliable across the genotypes, environments, seasons and management conditions for which it is intended, including in data beyond those used for development. It should assess sensitivity to the data and analytical choices, biological meaning, uncertainty, performance on independent data, and the validity of target ranges, classifications and thresholds.
What this means for Provar
Rather than relying on a single index in isolation, Provar combines appropriate validated indices, individual trait information and supporting evidence within a reporting framework. Each index summarises a specific dimension of cultivar performance, while traits critical to the intended decision remain visible in evaluation reports.
In multi-environment trials, mean performance, stability and the underlying genotype × environment interaction pattern help distinguish broad adaptation from potential specific adaptation. Evaluation coverage and statistical uncertainty indicate how confidently these results can be interpreted.
The aim is therefore not to replace complex evaluation data with a single number, but to make that complexity structured, traceable and interpretable.
Further Reading
Becker W, Saisana M, Paruolo P and Vandecasteele I. 2017. Weights and importance in composite indicators: closing the gap. Ecol Indic. 80:12–22.
Dobbie MJ and Dail D. 2013. Robustness and sensitivity of weighting and aggregation in constructing composite indices. Ecol Indic. 29:270–277.
Olivoto T, Lúcio ADC, da Silva JAG, Marchioro VS, de Souza VQ and Jost E. 2019a. Mean performance and stability in multi-environment trials I: combining features of AMMI and BLUP techniques. Agron J. 111(6):2949–2960.
Olivoto T and Nardino M. 2021. MGIDI: toward an effective multivariate selection in biological experiments. Bioinformatics. 37(10):1383–1389.
Rocha JRAS de C, Machado JC and Carneiro PCS. 2018. Multitrait index based on factor analysis and ideotype-design: proposal and application on elephant grass breeding for bioenergy. GCB Bioenergy. 10(1):52–60.

Rae is the Scientific Publications and Research Conceptualisation Lead at Provar. She is a qualified horticulturist, scientific writer and editor and holds a doctorate in plant breeding. In her role, she works at the intersection of scientific research and applied evaluation, developing research concepts, trial designs, and strategies for implementation. Rae also plays a key role in the scientific development of Provar’s Culteva™ platform, creating literature-based concepts to ensure scientific rigour. Additionally, she supports Provar’s scientific publications, technical reports, conference materials, project planning and research funding applications, collaborating across various disciplines and organisations.